How Energy Companies Can Turn Reporting from a Cost Center into an Operational Advantage
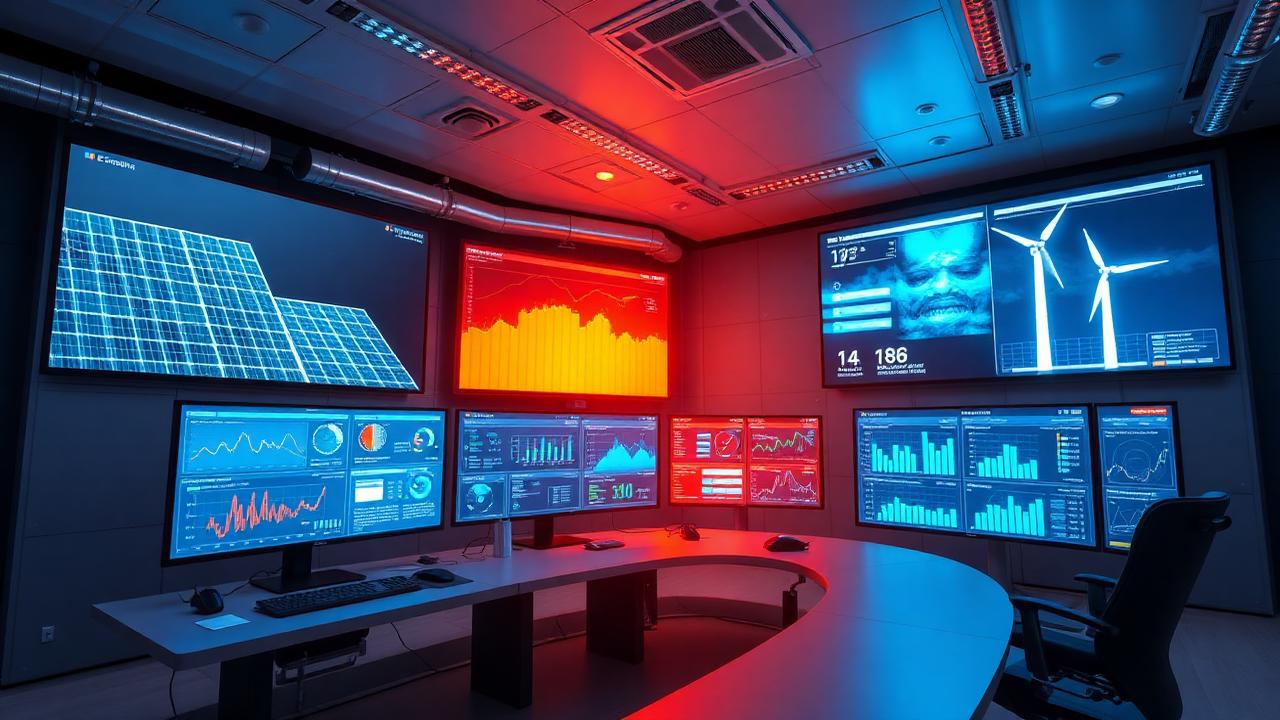
Energy companies produce more reports than almost any other industry. Performance reports. Production reports. O&M reports. Client reports. Regulatory reports. Incident reports.
Reporting is absolutely critical. And yet, in most energy organizations, it is still: Slow. Expensive. Rigid. And deeply misaligned with real operational needs.
As data volumes from solar plants, wind farms, batteries, EMS, SCADA, and IoT platforms keep exploding, reporting has become harder, not easier.
But today, energy companies have a real opportunity to radically change how reporting is created, used, and automated.
1. The True Cost of Reporting in Energy Operations
In most energy companies, reporting still relies on:
- •Manual SQL queries
- •Spreadsheet exports
- •Data cleaning
- •Dashboard maintenance
- •Repeated validation cycles
This typically involves data analysts, data engineers, O&M engineers, and sometimes external consultants.
The reality:
- A single recurring report often costs several thousand dollars per month
- Annual reporting costs per team often exceed $50k to $150k
For outputs that are: Static. Often outdated by the time they are read. Rarely actionable at the operational level.
What makes it worse is that this cost is diffuse — spread across multiple teams, buried in man-hours, accepted as "normal operations." But it shouldn't be.
2. The Real Problem: Energy Teams Struggle to Express Their Reporting Needs
Ask an operations or asset manager: "What reports do you need?"
You usually get either no clear answer, or a long list of KPIs copied from existing dashboards.
That's not because people don't know their problems. It's because real operational questions are situational. They change with weather, failures, grid constraints, curtailment, O&M capacity, and client pressure.
People don't think in terms of:
- • Report templates
- • KPIs
- • Dashboards
They think in terms of:
- "Why did production drop on this site?"
- "Which inverters are drifting?"
- "Which batteries are degrading faster than expected?"
- "Which assets are going to trigger support tickets tomorrow?"
Traditional reporting tools force living operational questions into static structures. That's why reporting rarely reflects reality.
3. The Shift: Reporting Should Be a Byproduct of Data Exploration
Historically, the logic has been: Define the report → Build pipelines → Validate → Distribute
This assumes needs are stable, questions are known in advance, and operations are predictable. In energy, none of this is true.
The real logic is:
People explore data → Ask operational questions → Discover patterns → Repeat the same questions → Those questions become reportable
This is the model that finally matches how energy operations actually work.
4. What Changes with a Time Series–Specialized AI Agent
When an AI Agent can query raw time-series data directly, with no latency, energy teams stop waiting for reports and start asking questions directly:
- "Which PV plants underperformed yesterday vs irradiation?"
- "Which wind turbines triggered repeated alarms this week?"
- "Which batteries show abnormal temperature drift?"
- "Which sites will breach SLA within 48 hours?"
Each question instantly returns a quantified answer, a curve, a comparison, and a clear operational signal.
And most importantly: a trace of real operational intent. This is the missing link between what people actually care about and what eventually deserves to be automated as a report.
5. From Conversations to Automated Energy Reports
Here is how the loop works in practice:
1Free Operational Exploration
O&M, asset managers, and support teams ask questions in natural language. No dashboards to pre-build. No backlog. No waiting on data teams.
2Recurrent Energy Questions Emerge
After days or weeks, clear usage patterns appear:
- • Daily production deviations
- • Repeated inverter health checks
- • Weekly performance ranking
- • Recurring incident analysis
- • Monthly client performance summaries
Now the needs are no longer theoretical. They are proven by behavior.
3Prompts Become Report Structures
These recurring questions become pre-built prompts and parameterized report templates — role-specific for O&M, asset management, support, management, and clients. No guessing. No workshops. Only real usage transformed into structure.
4Full Report Automation
The Agent now runs the prompts on a schedule, generates the report, formats it, and sends it automatically. Zero human workload. Near-zero marginal cost. And reports that are finally aligned with real operations.
6. This Is Not "AI Deciding What Matters" — It's a Co-Pilot Model
In energy, fully autonomous AI decision-making is a dangerous fantasy.
What actually works is:
- Humans explore
- Humans ask questions
- Humans validate meaning
The Agent learns from those questions and automates only what proves its value. This keeps expertise in human hands, automation in execution, and accountability where it belongs.
This is exactly the difference between black-box AI and a trustworthy operational co-pilot for energy teams.
7. Concrete Energy Reporting Use Cases Already Working
This approach is already being used for:
- Daily solar & wind performance reporting
- Multi-site asset health summaries
- Battery degradation monitoring
- Client SLA and availability reporting
- Support incident automation
- Curtailment and grid impact analysis
- Predictive maintenance preparation
In every case, the same pattern applies: Exploration → Recurrent questions → Automated reports
8. The Outcome: Reporting Becomes Faster, Cheaper, and Operational
Once reporting is driven by real operational questions instead of static KPIs:
- Reporting cost collapses
- Relevance skyrockets
- Reports evolve naturally with assets and seasons
- Energy teams spend time on decisions, not report maintenance
Reporting stops being an administrative burden and becomes a continuous operational advantage.
Final Takeaway
Energy companies don't have a reporting tool problem. They have an exploration bottleneck.
As long as questions are locked behind analysts and needs are defined through static dashboards, reporting will remain expensive, slow, and misaligned with reality.
Time series–specialized AI Agents change that by allowing companies to:
- Capture real operational questions
- Turn usage into structure
- Turn structure into automation
Without disconnecting humans from decisions.
This is how energy companies shift from reporting as a painful obligation to reporting as a living operational intelligence layer.
Ready to transform your energy reporting?
See how Spocky helps energy companies turn data exploration into automated, operational reporting.